07. How to Evaluate Guardrails

7.1 Overview
Enterprises can prevent models from outputting unwanted content, such as harmful statements, by implementing guardrails on their AI systems that flag or block content. However, the effectiveness of these guardrails must be evaluated carefully. Efficient and comprehensive evaluation of guardrails enables enterprises to:
- Understand the effectiveness of their guardrails at blocking unwanted content, thus making informed decisions about whether or not to deploy their AI systems;
- Document and provide evidence of generative AI controls to regulators and risk management stakeholders; and
- Prevent deployments of ineffective guardrails, which can endanger end-users and create business risks such financial and reputational harm. Ineffective guardrails may also inefficiently use effort and resources, such as through excessive false flags.
- In a recent study published by Nvidia7 researchers found that guardrailing can cost up to three times more than serving the underlying language model, further highlighting the importance of evaluating guardrails to manage costs.
7.2 High-Level Process and Common Pitfalls
High-Level Process
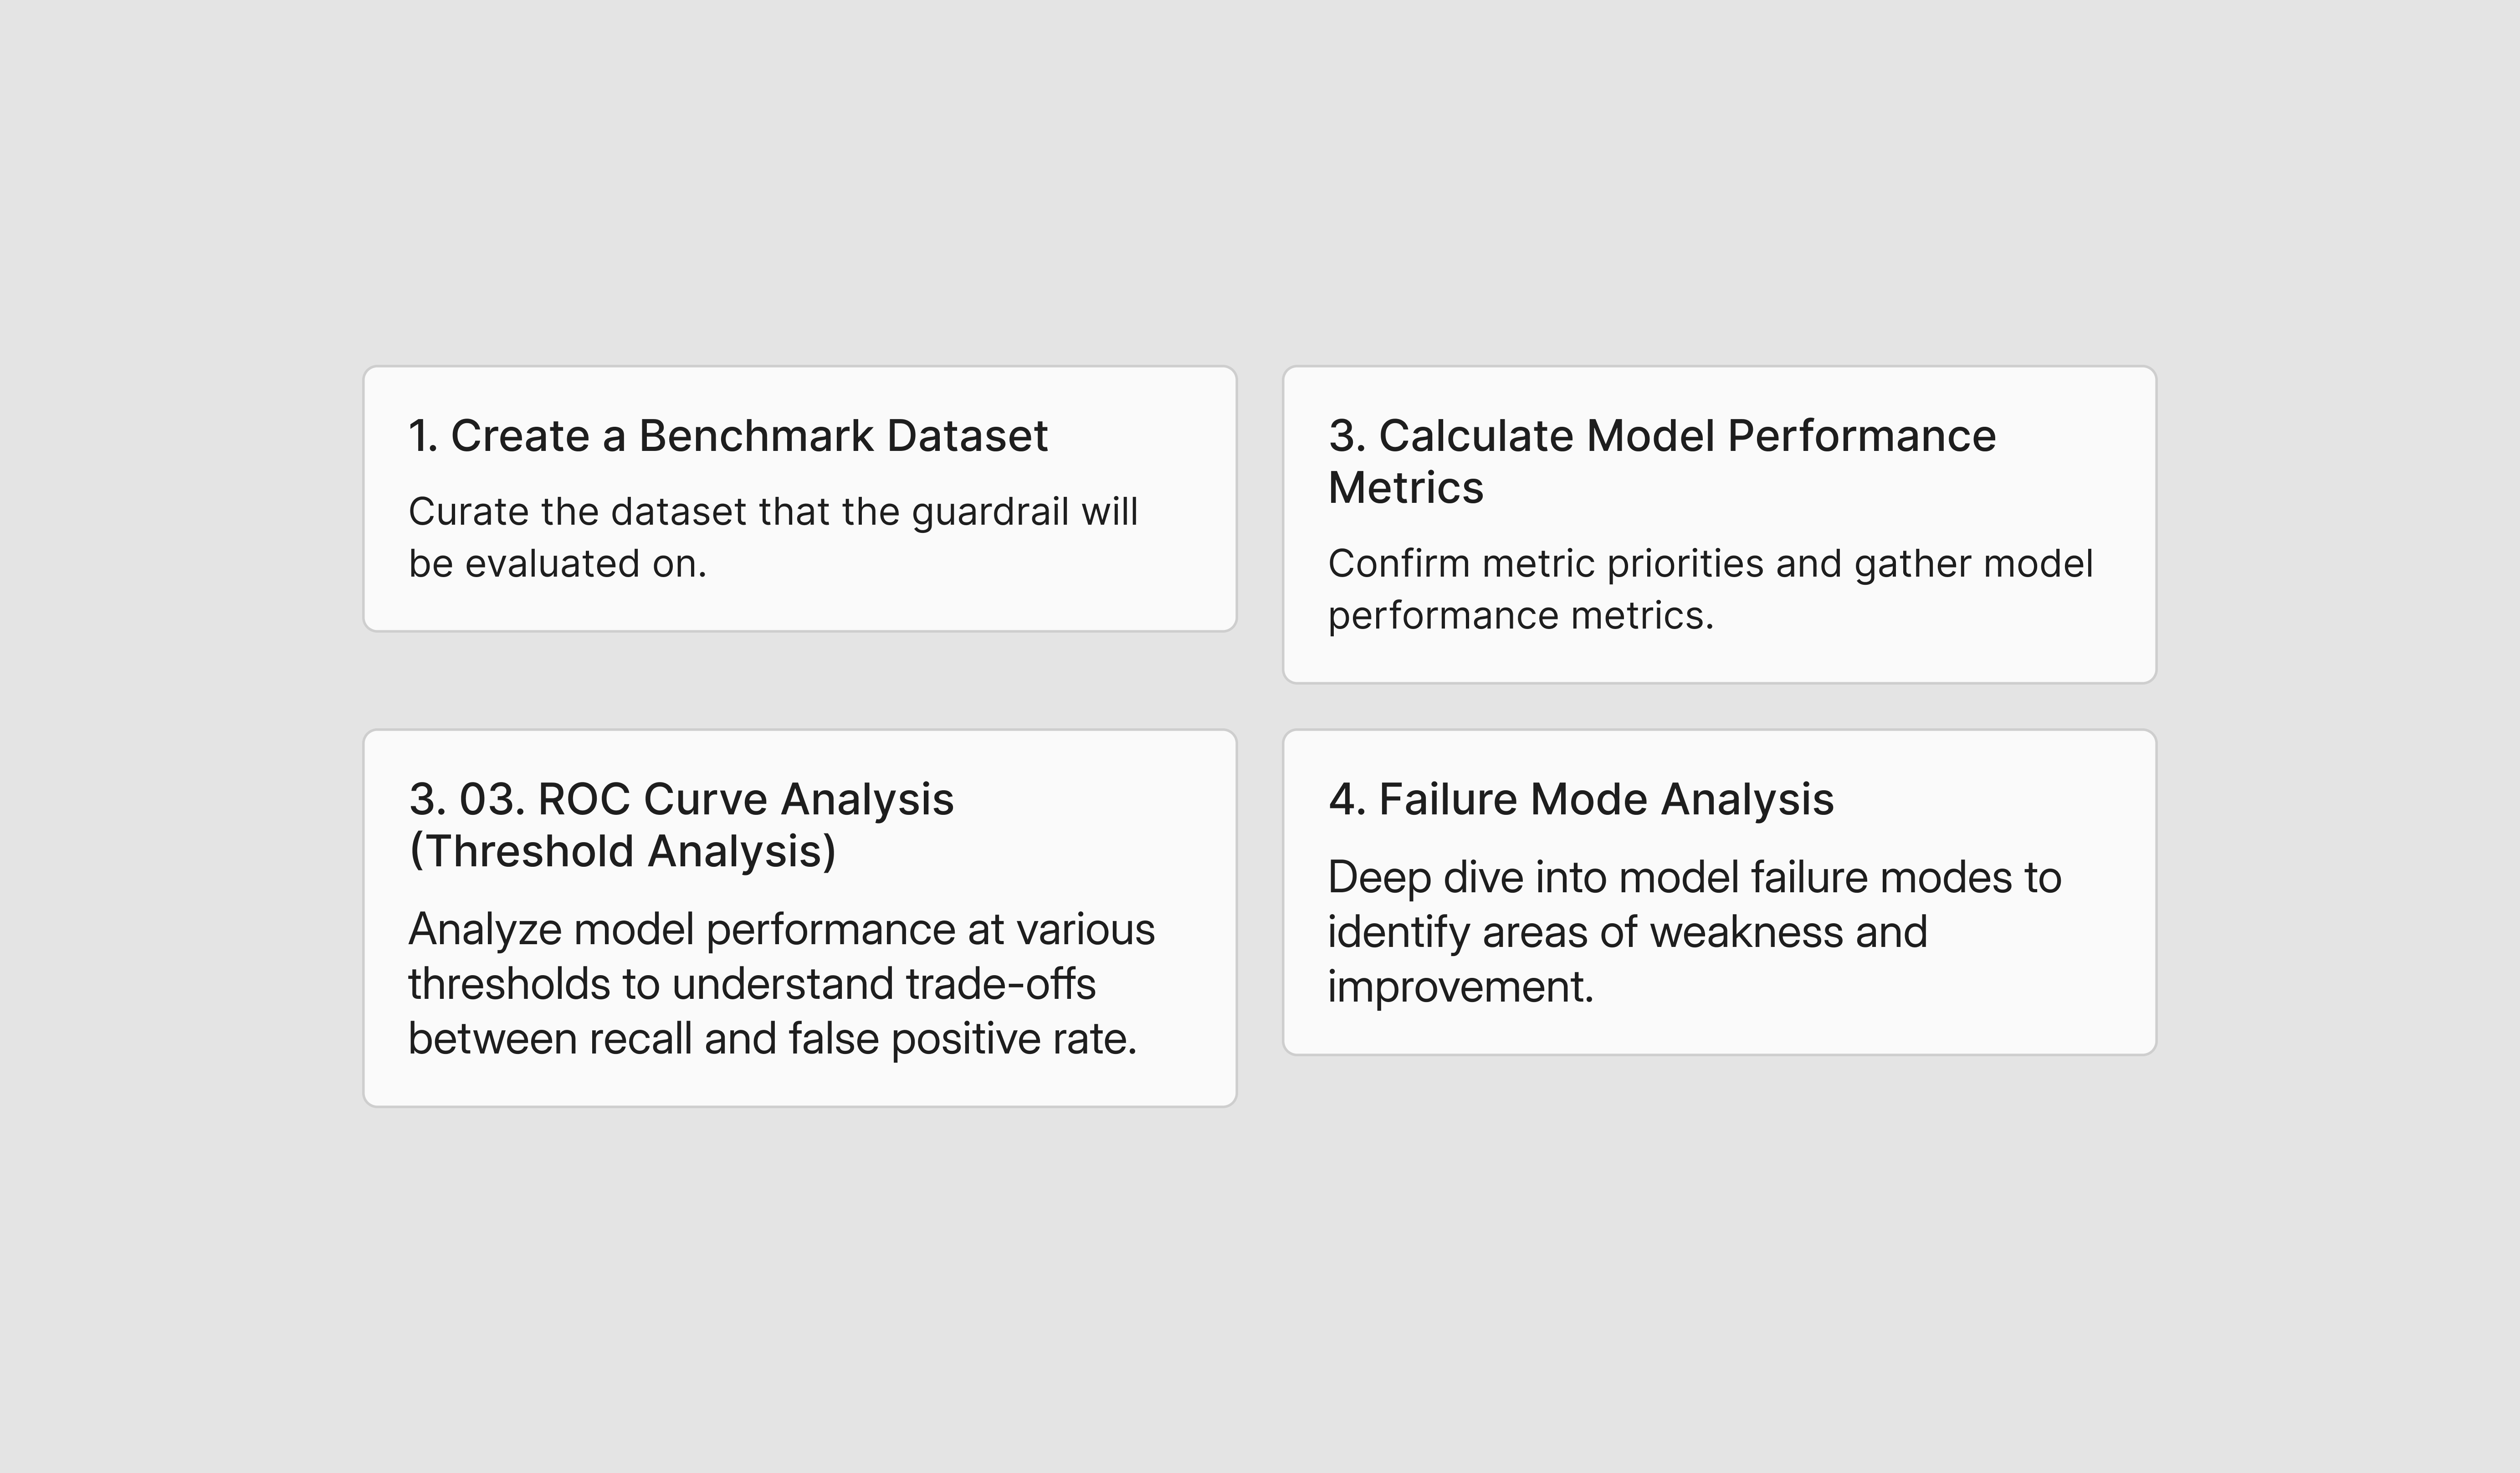
The following 4 steps are required to effectively evaluate guardrail implementation:
Common Pitfalls
Pitfalls of Traditional Evaluation Approaches
Existing methods for evaluating guardrails often fall short when applied to LLMs, as they fail to address the unique challenges of AI systems.
- Stakeholders often over-index on recall, degrading user experience: Traditional cybersecurity teams typically prioritize recall, striving to detect and prevent every potential safety threat. This approach is effective in traditional cybersecurity contexts, where increased safety guardrails don’t directly impact the user's product experience. However, when applied to LLMs, this approach often leads to overly restrictive guardrails that generate excessive false positives, ultimately degrading the end-user experience and leading to higher costs for the enterprise who needs to triage and evaluate each positive flag.
- AI Systems must be evaluated for compliance in addition to safety: While most traditional evaluations focus on safety and toxicity datasets during evaluation, AI systems must also be evaluated for compliance with a given enterprises’ policies and regulatory requirements. For example, a customer chatbot should be evaluated not only on its resistance to outputting toxic and unsafe content, but also on its compliance with federal laws, such as not providing legal advice to users.
- Manual Red-Teaming is not comprehensive and cannot scale: While manual human red-teaming of a model and its guardrails is helpful for surfacing vulnerabilities in the guardrail system, it is not scalable as the number of guardrails and use cases grow. The time and resources required to test every possible failure mode manually become prohibitive, thus compromising coverage across all necessary test cases.
- Red-Teaming with LLMs is not explainable or auditable: Using LLMs to evaluate guardrails offers efficiency but introduces its own challenges. Automated red-teaming often lacks explainability and auditability, which are critical for risk and compliance teams. Furthermore, LLMs can hallucinate or be influenced by poisoned data, making their judgments unreliable, and can even have their own internal biases towards certain types of text or content.
7.3 Roles & Responsibilities and Related Industry Practices
Roles & Responsibilities and Related Industry Practices
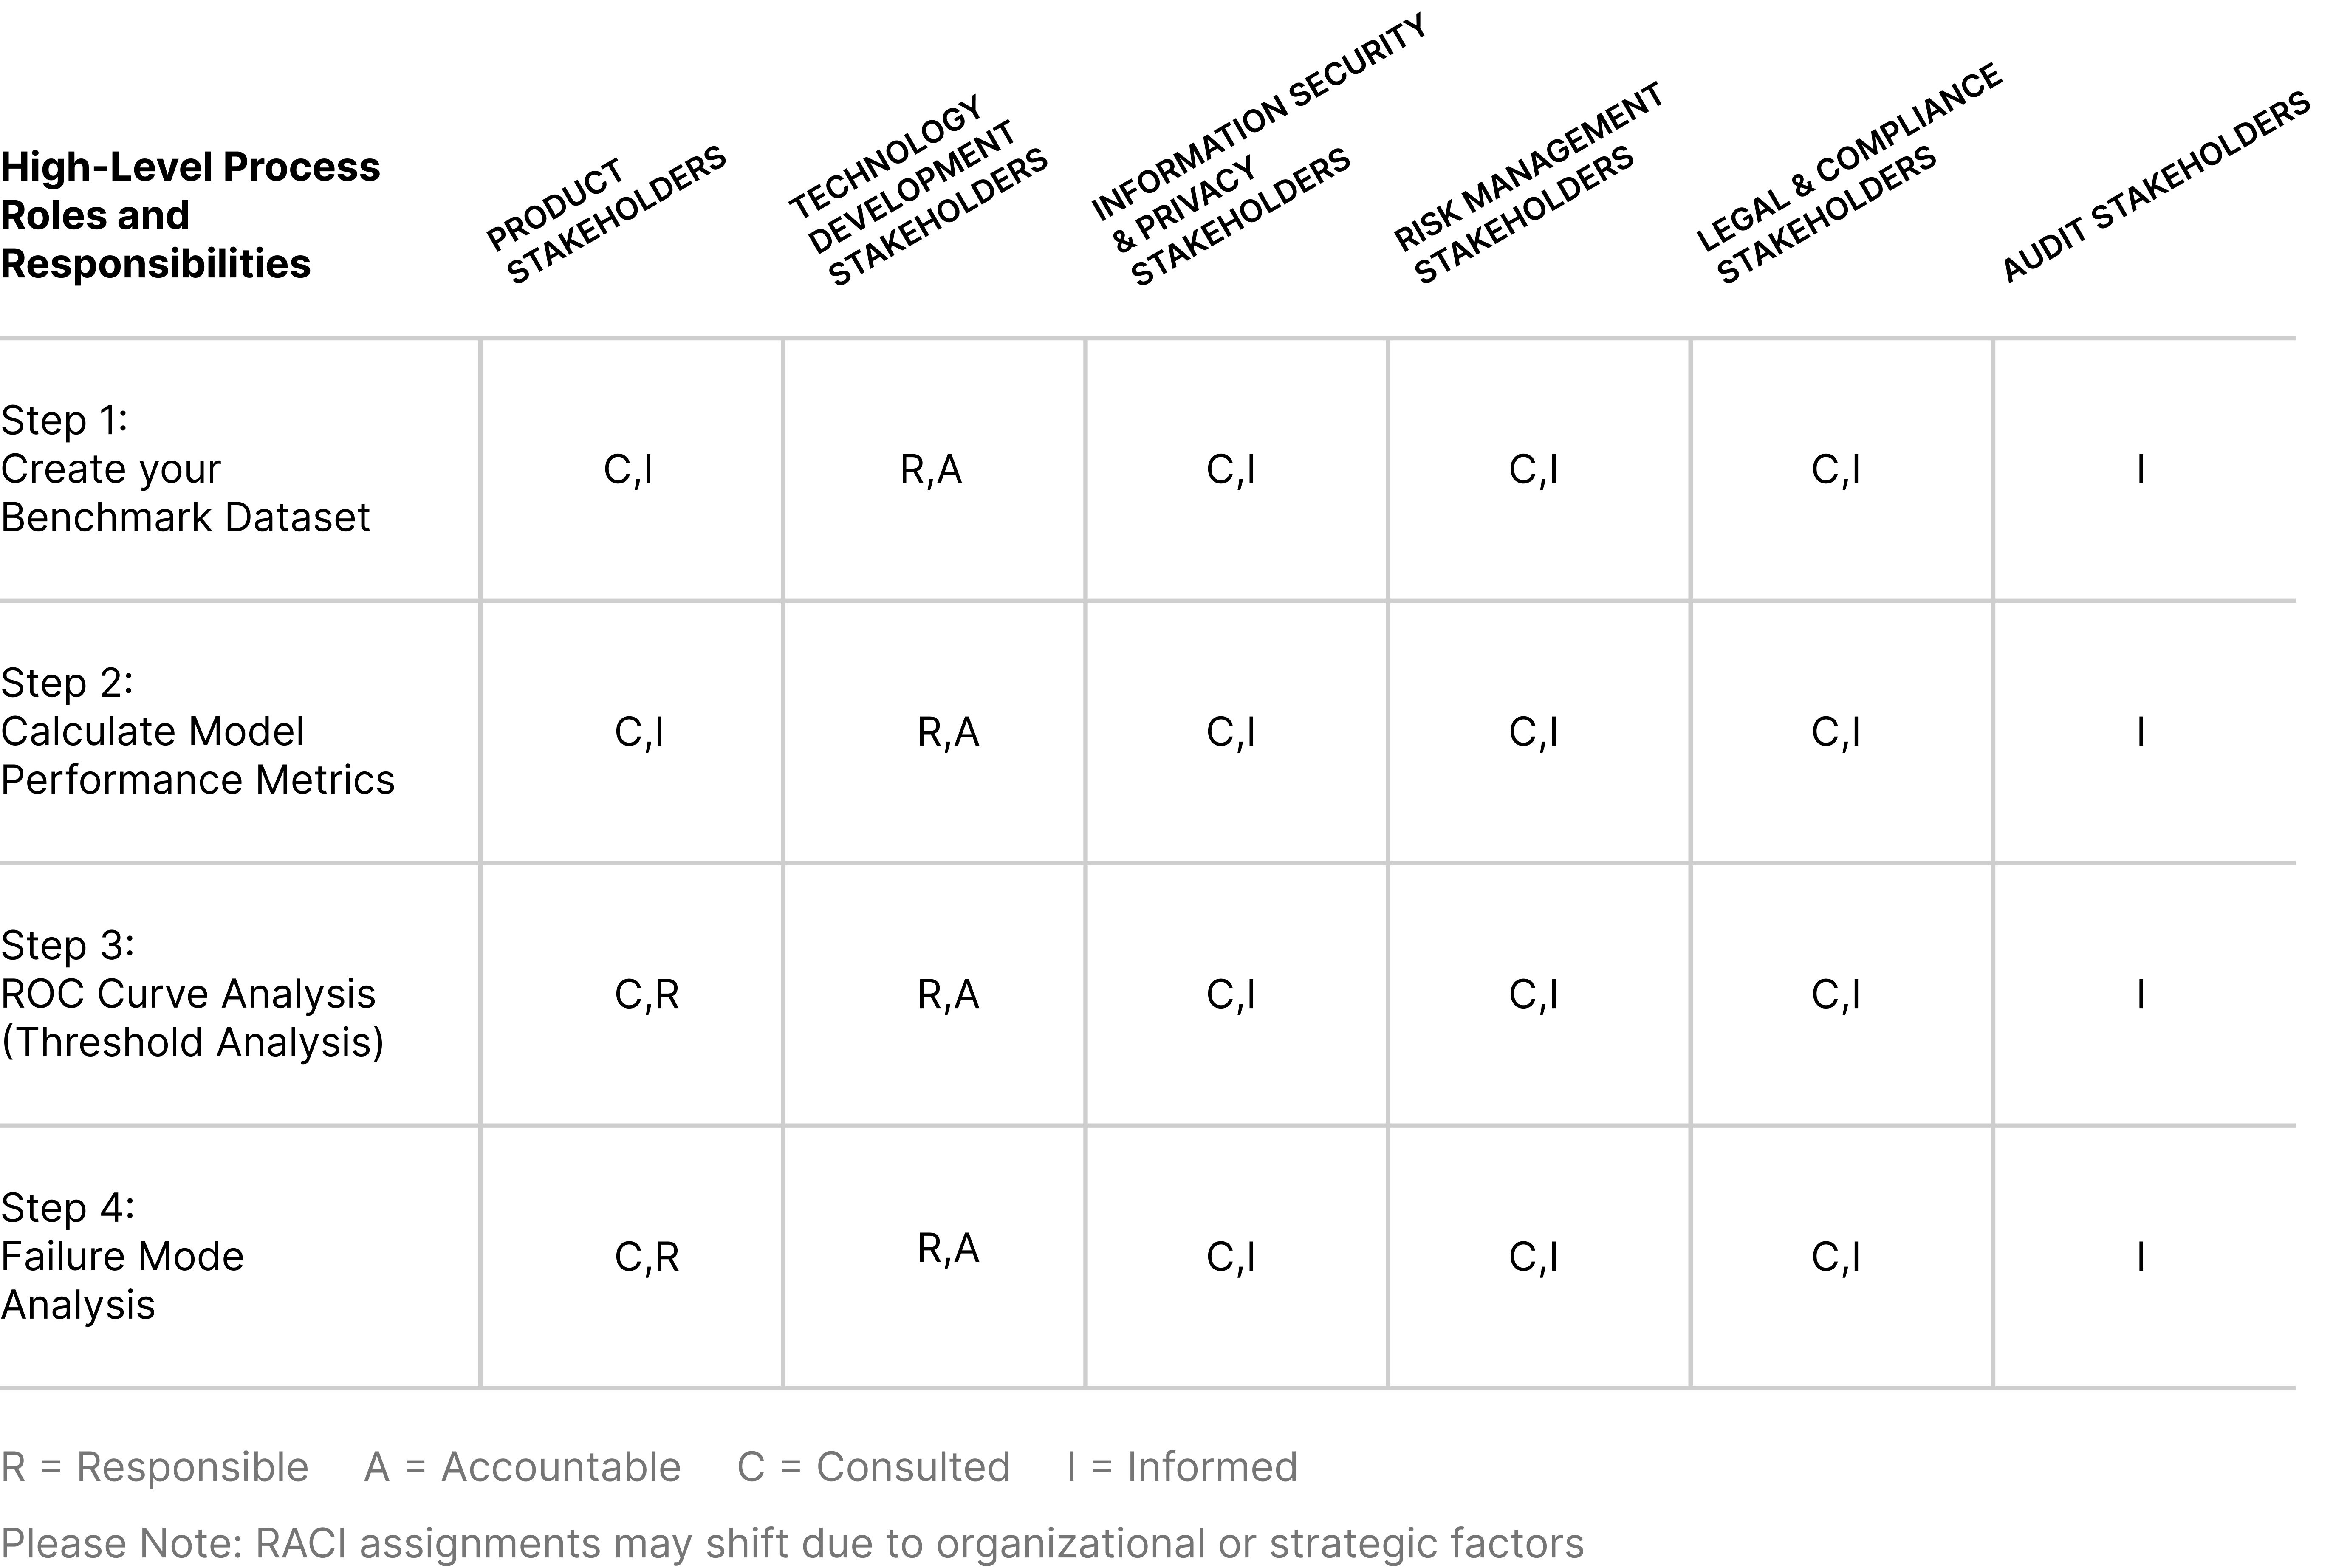
The following RACI chart is a generalized approach for how to structure responsibilities among organizational stakeholders. However, depending on the guardrail and its domain focus, different subject matter experts can take on additional responsibilities. For example, a guardrail focused on preventing legal advice may need more involvement from Legal stakeholders than what is outlined below.
💡 Estimating Resource Effort
It is recommended that enterprises align resourcing efforts to several factors including the number of enabled AI use cases, volume of use case engagement, risk tolerance, and performance expectations.
For example, evaluating 5 guardrails over a 4-week period may require the following resource effort:
- 2 hours per guardrail to create a benchmark data set for evaluation.
- 1 hour per guardrail to calculate the model performance and complete ROC curve analysis.
On average, up to 5 hours of effort per guardrail to review and improve the guardrail. The effort for this task varies due to a number of factors including the quality of the guardrail definition as well as the quality and performance targets of the enterprise.
In summary, the evaluation effort for 5 guardrails over the course of 4 weeks may range from 15 – 40 hours of effort.
Related Industry Practices
However, not all traditional evaluation approaches should be disregarded. Technology organizations have productionized content moderation operating models that rely on a combination of automated content moderation models and human reviewers, which is a helpful resource for how AI system evaluation should be conducted. Within these content moderation systems, a model automatically flags and bans content that it has high confidence on but surfaces content that it is less confident about to human reviewers. Human reviewers then manually audit flagged items to assess the content model’s performance and deal with these tricky edge cases. The decisions made by human reviewers are then used to fine tune and further improve the model performance, as the model will learn how to deal with more and more edge cases as it learns from the human decisions.
Enterprises managing AI systems can adopt similar operating models, leveraging automated guardrails for efficiency while integrating human oversight for complex or high-stakes scenarios. In Sections 6, Dynamo AI details a best-practice approach for how to execute an initial evaluation of guardrails, which is the starting point for a continuous data flywheel. A separate playbook which walks through continuous monitoring is documented in Section 8.
7.4 Playbook Detail: Guardrail Evaluation Process
Playbook Detail: Guardrail Evaluation Process
The following 4 steps provide a detailed operating model for the Guardrail Evaluation Process:
7.4.1 Benchmark Dataset Creation
A benchmark dataset, also known as a validation dataset, is the collection of accurately labeled data which is used for evaluating model performance. It provides the ground truth labels which the guardrail's predicted outputs are compared against. Benchmarks are also useful as the dataset for measuring guardrail performance over time, or ranking performance of guardrails against each other.
To effectively evaluate guardrails, it is critical for the benchmark dataset to be both representative of the use-cases where the guardrail will be applied, while also including edge cases that test the model’s boundaries.
Dataset Structure
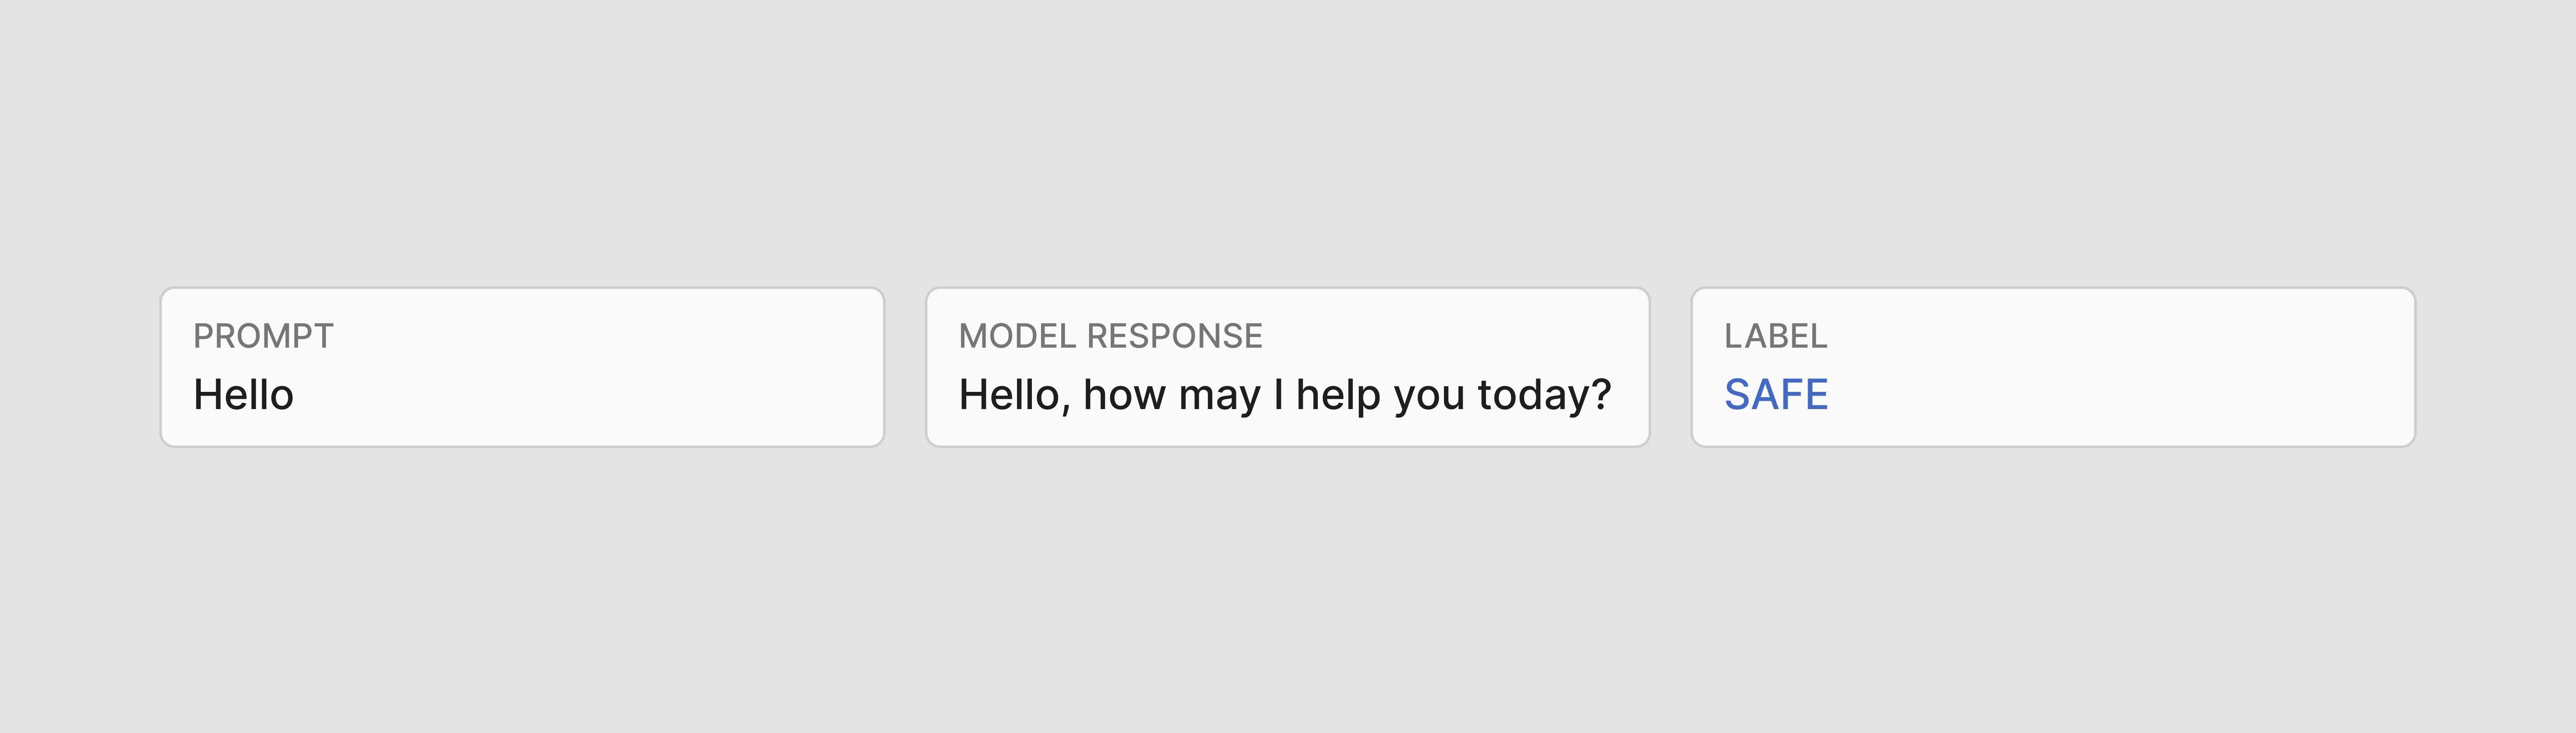
For input guardrails, the data must include two columns: the input text which the guardrail is running on, and the correct guardrail label that applies to the prompt (“safe”/“unsafe”).

For output guardrails, the data should include three columns: the input prompt, the response, and then the correct label of the response.
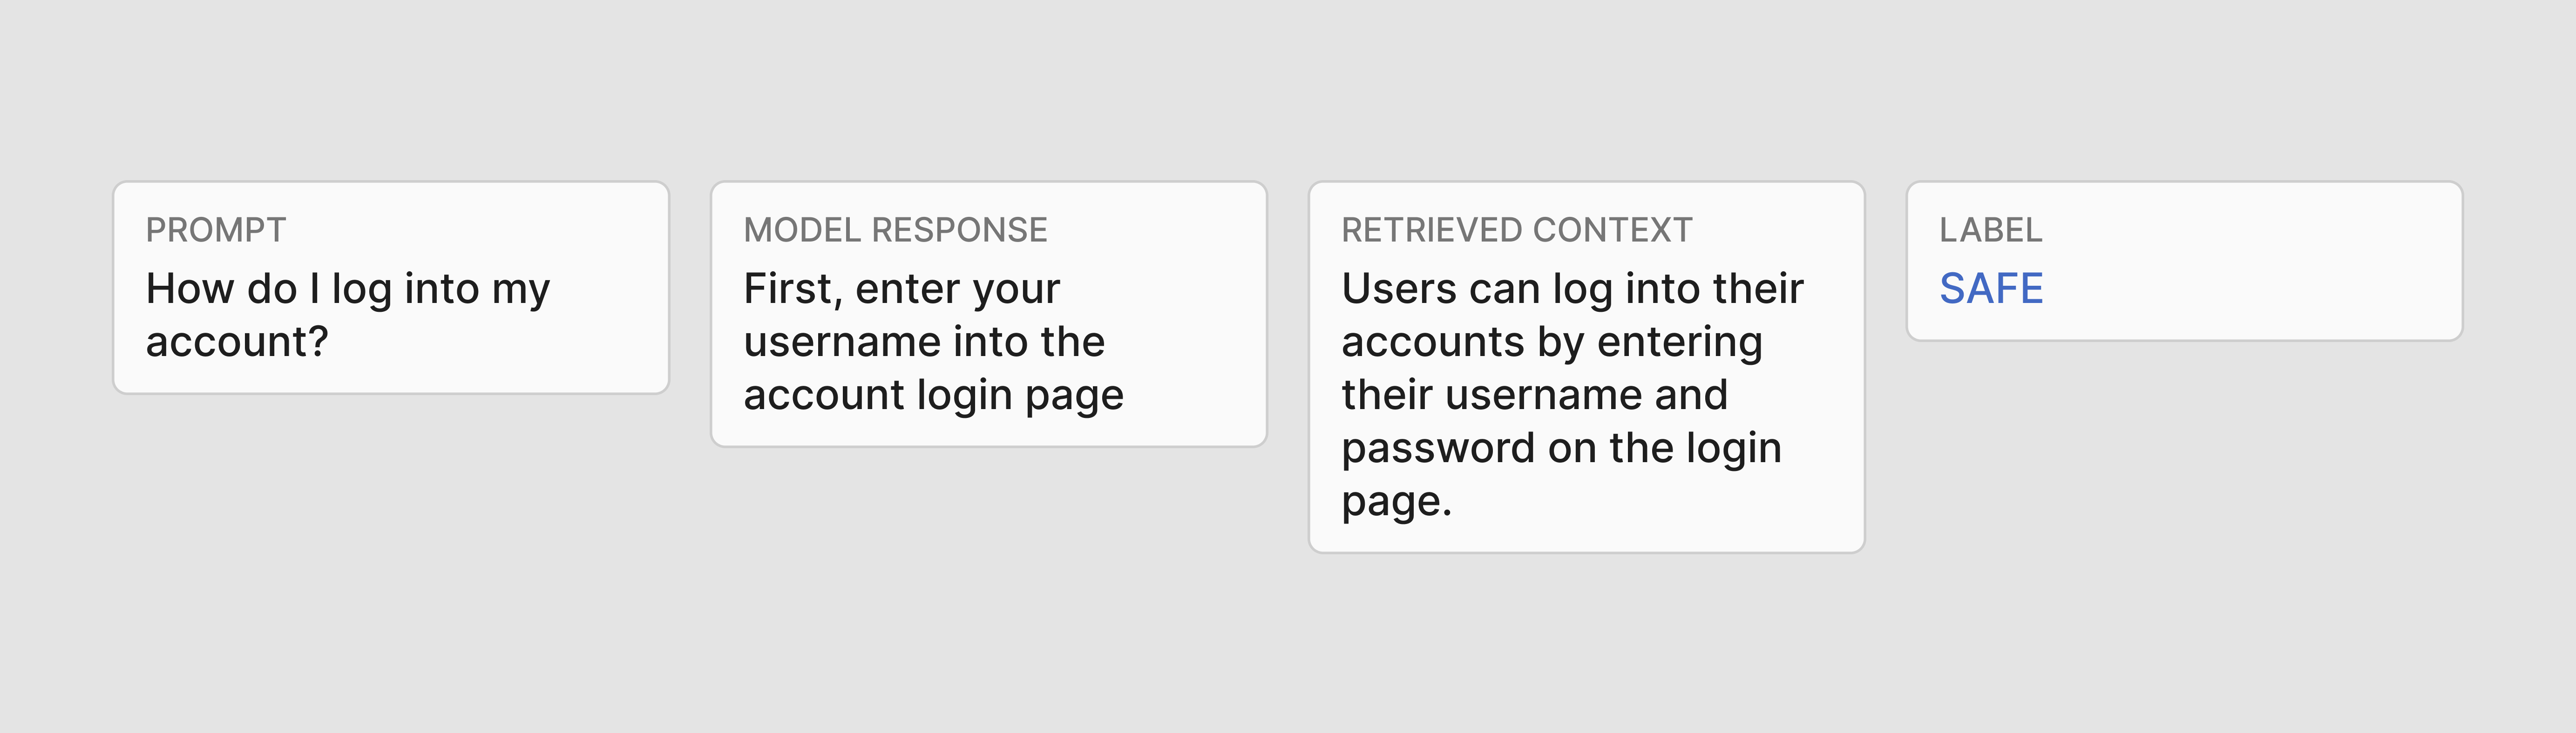
Finally, for Retrieval Augmented Generation (RAG) guardrail evaluation, a fourth column with the retrieved context is also required.
Data Volume
Dynamo AI recommends a minimum of 100 data samples to benchmark against. Large data volumes ensure coverage across all relevant use cases at statistically significant levels. Our internal benchmarking datasets include over 100 samples to capture all possible use cases.
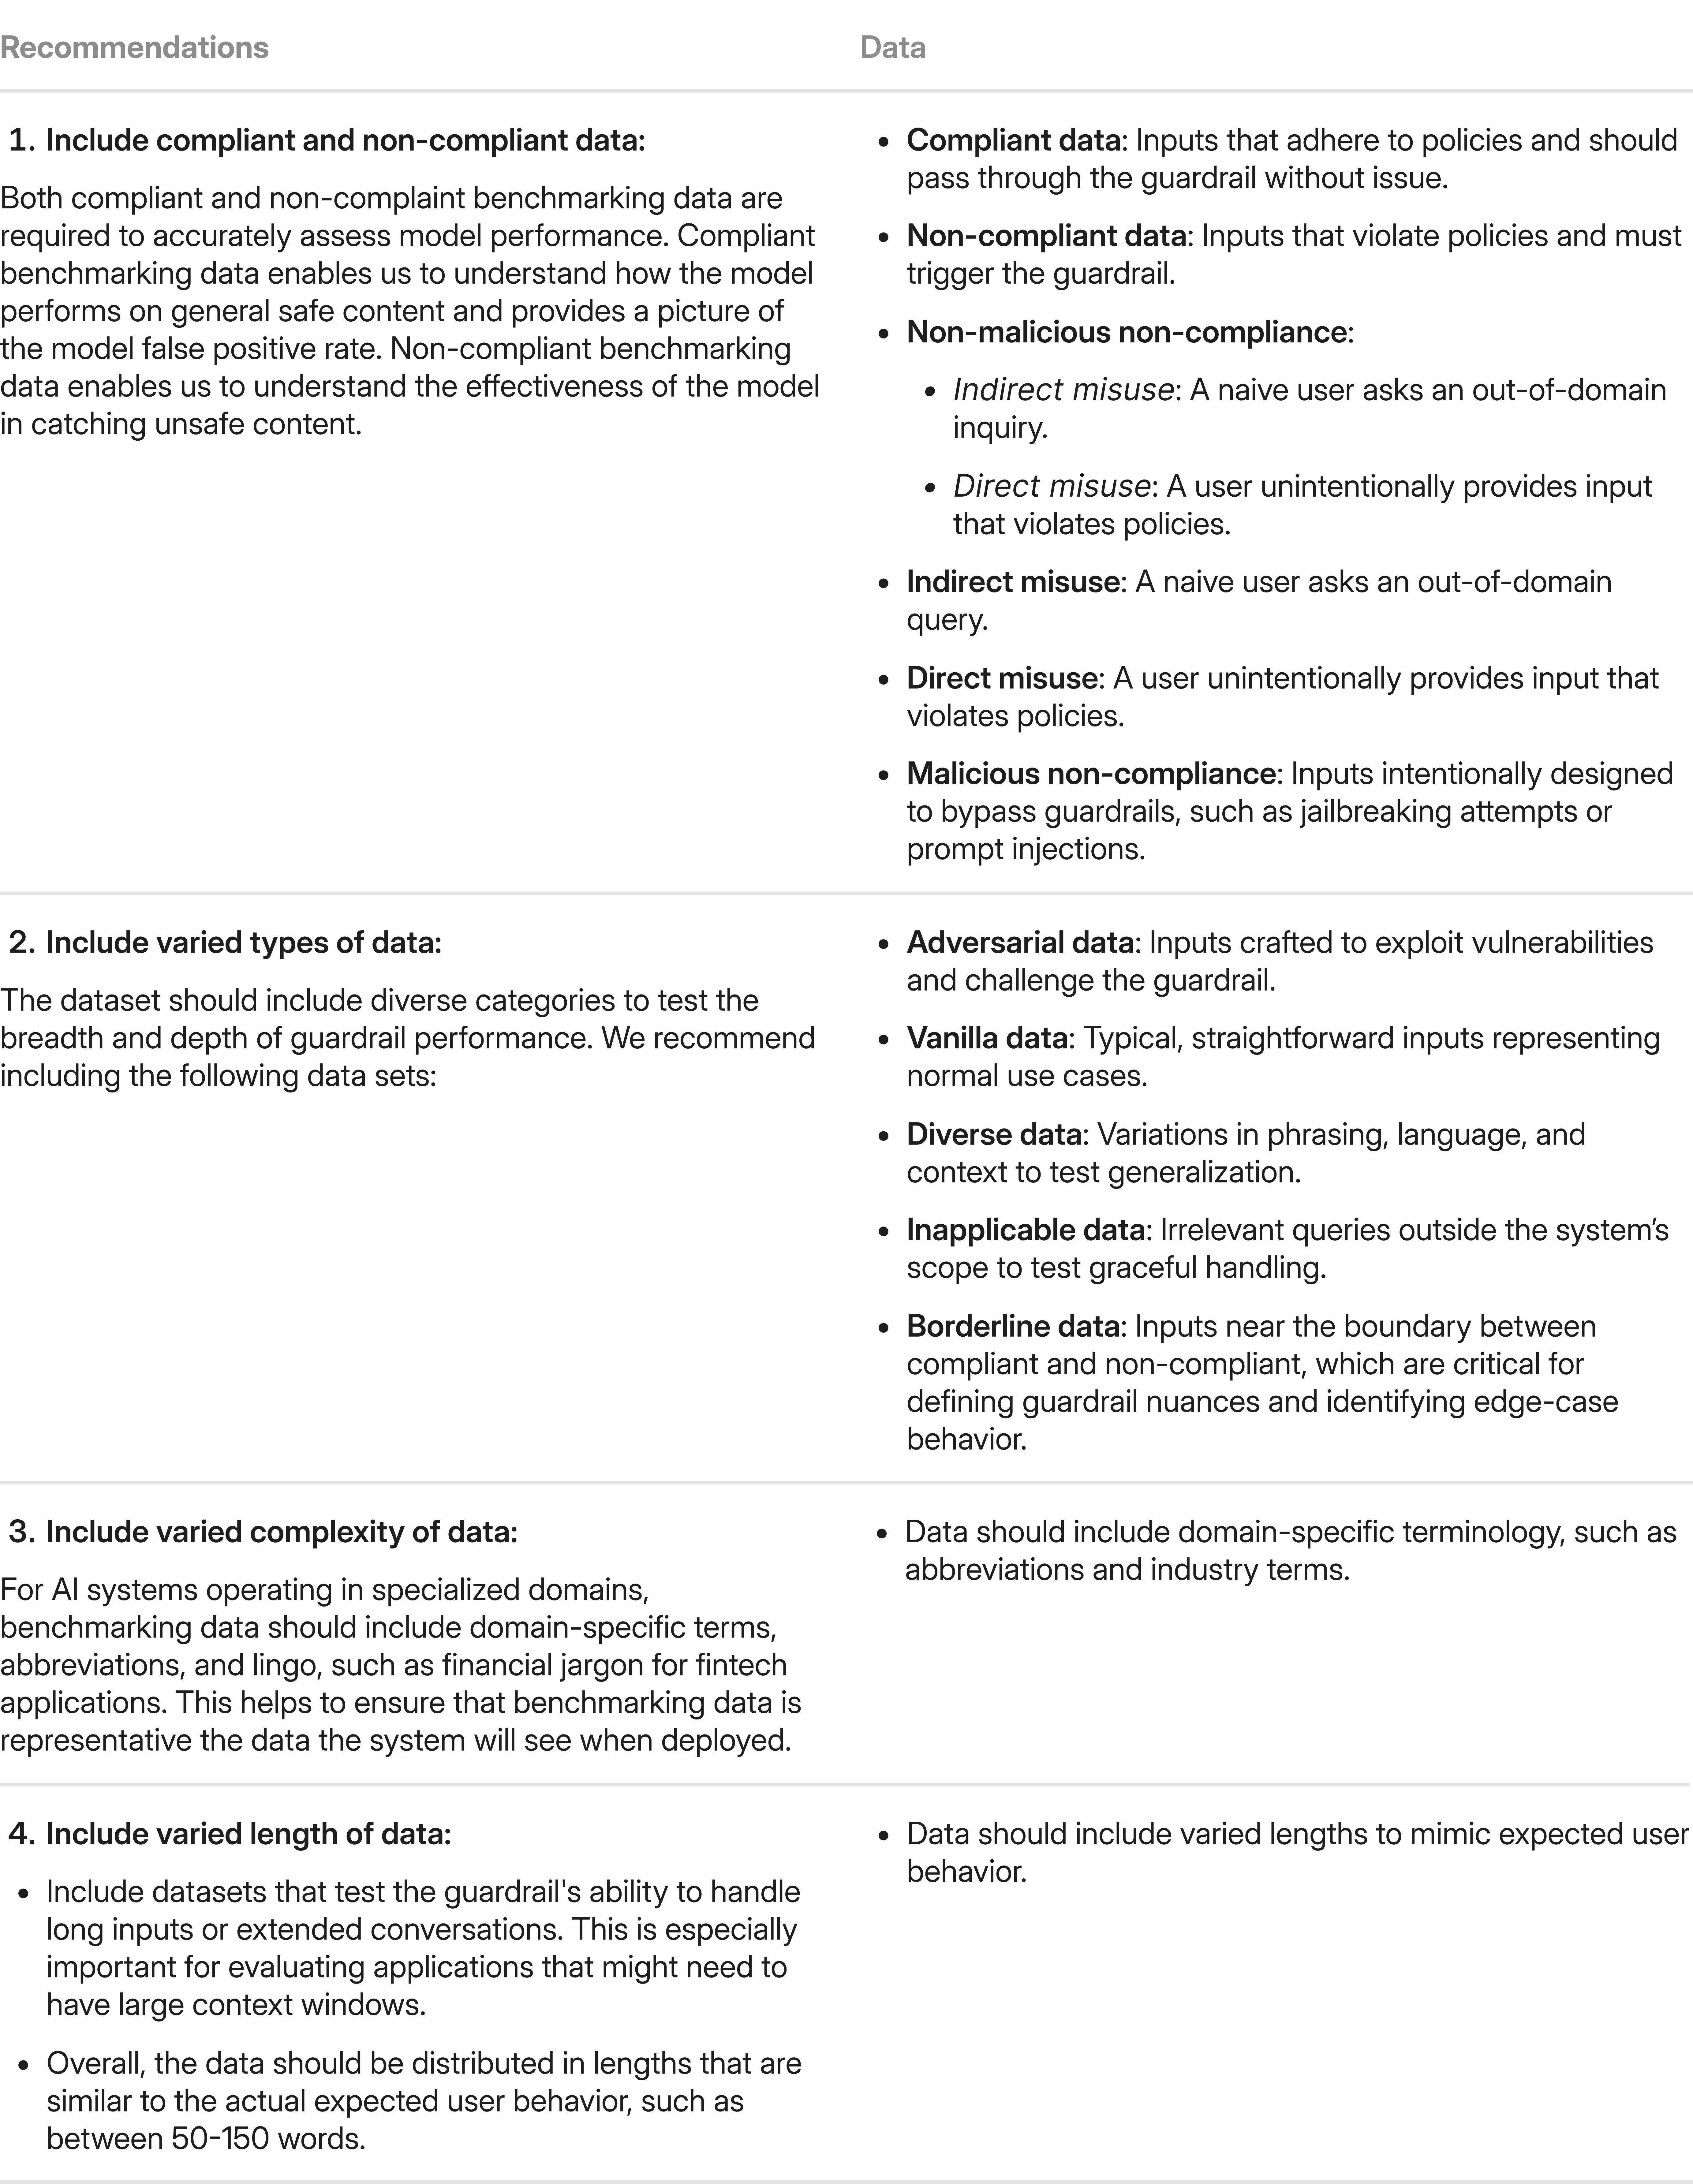
Dataset Composition
As a rule of thumb, benchmarking data should match the intended use case for the AI system, while also including a portion of non-use-case specific data to test model misuse. This is because the benchmark should try to capture an accurate assessment of the model's capabilities when productionized.
Obtaining Data
Depending on your desired data composition, you can obtain benchmarking data in a variety of ways. If you have existing usage data for your AI system or platform, you can label the usage data and then directly add it to a benchmarking dataset.
If sourcing data manually is a challenge due to a lack of existing user data or especially rare use cases, synthetically generating variations can also help diversify your dataset. Synthetic data can be used to generate additional examples from a seed data point or raw text inputs, which helps create large quantities of varied data that would otherwise be hard to find.
When using synthetic data, you can provide two types of data to guide generation:
- Labeled seed data: These are seed datapoints that have already been tagged with “safe” or “unsafe” labels, helping the synthetic generation model learn to produce correctly labeled outputs.
- Unlabeled raw usage data: Any usage data, including unlabeled raw text snippets, can still help generate synthetic examples that are more aligned with your expected domain and use case.
After generation, synthetic data should always be audited to ensure that it matches the intended style and use case, and that the synthetic compliance labels are correct.
7.4.2 Calculate Model Performance Metrics
After finalizing a benchmark dataset, enterprises should evaluate the model on a variety of metrics. These metrics can be grouped into three key axes of performance: risk mitigation, end-user experience, and scalability. Each axis provides essential insights into how well a guardrail performs. However, depending on factors like the guardrail and your AI use case, you might need to balance these three axes differently and prioritize different metrics.
Evaluating guardrails along these three axes below help enterprises ensure they effectively mitigate risks while maintaining usability and efficiency.

Axis 1 - Risk Mitigation: Protecting the User
The primary purpose of a guardrail is to minimize risk by preventing harmful or non-compliant outputs.
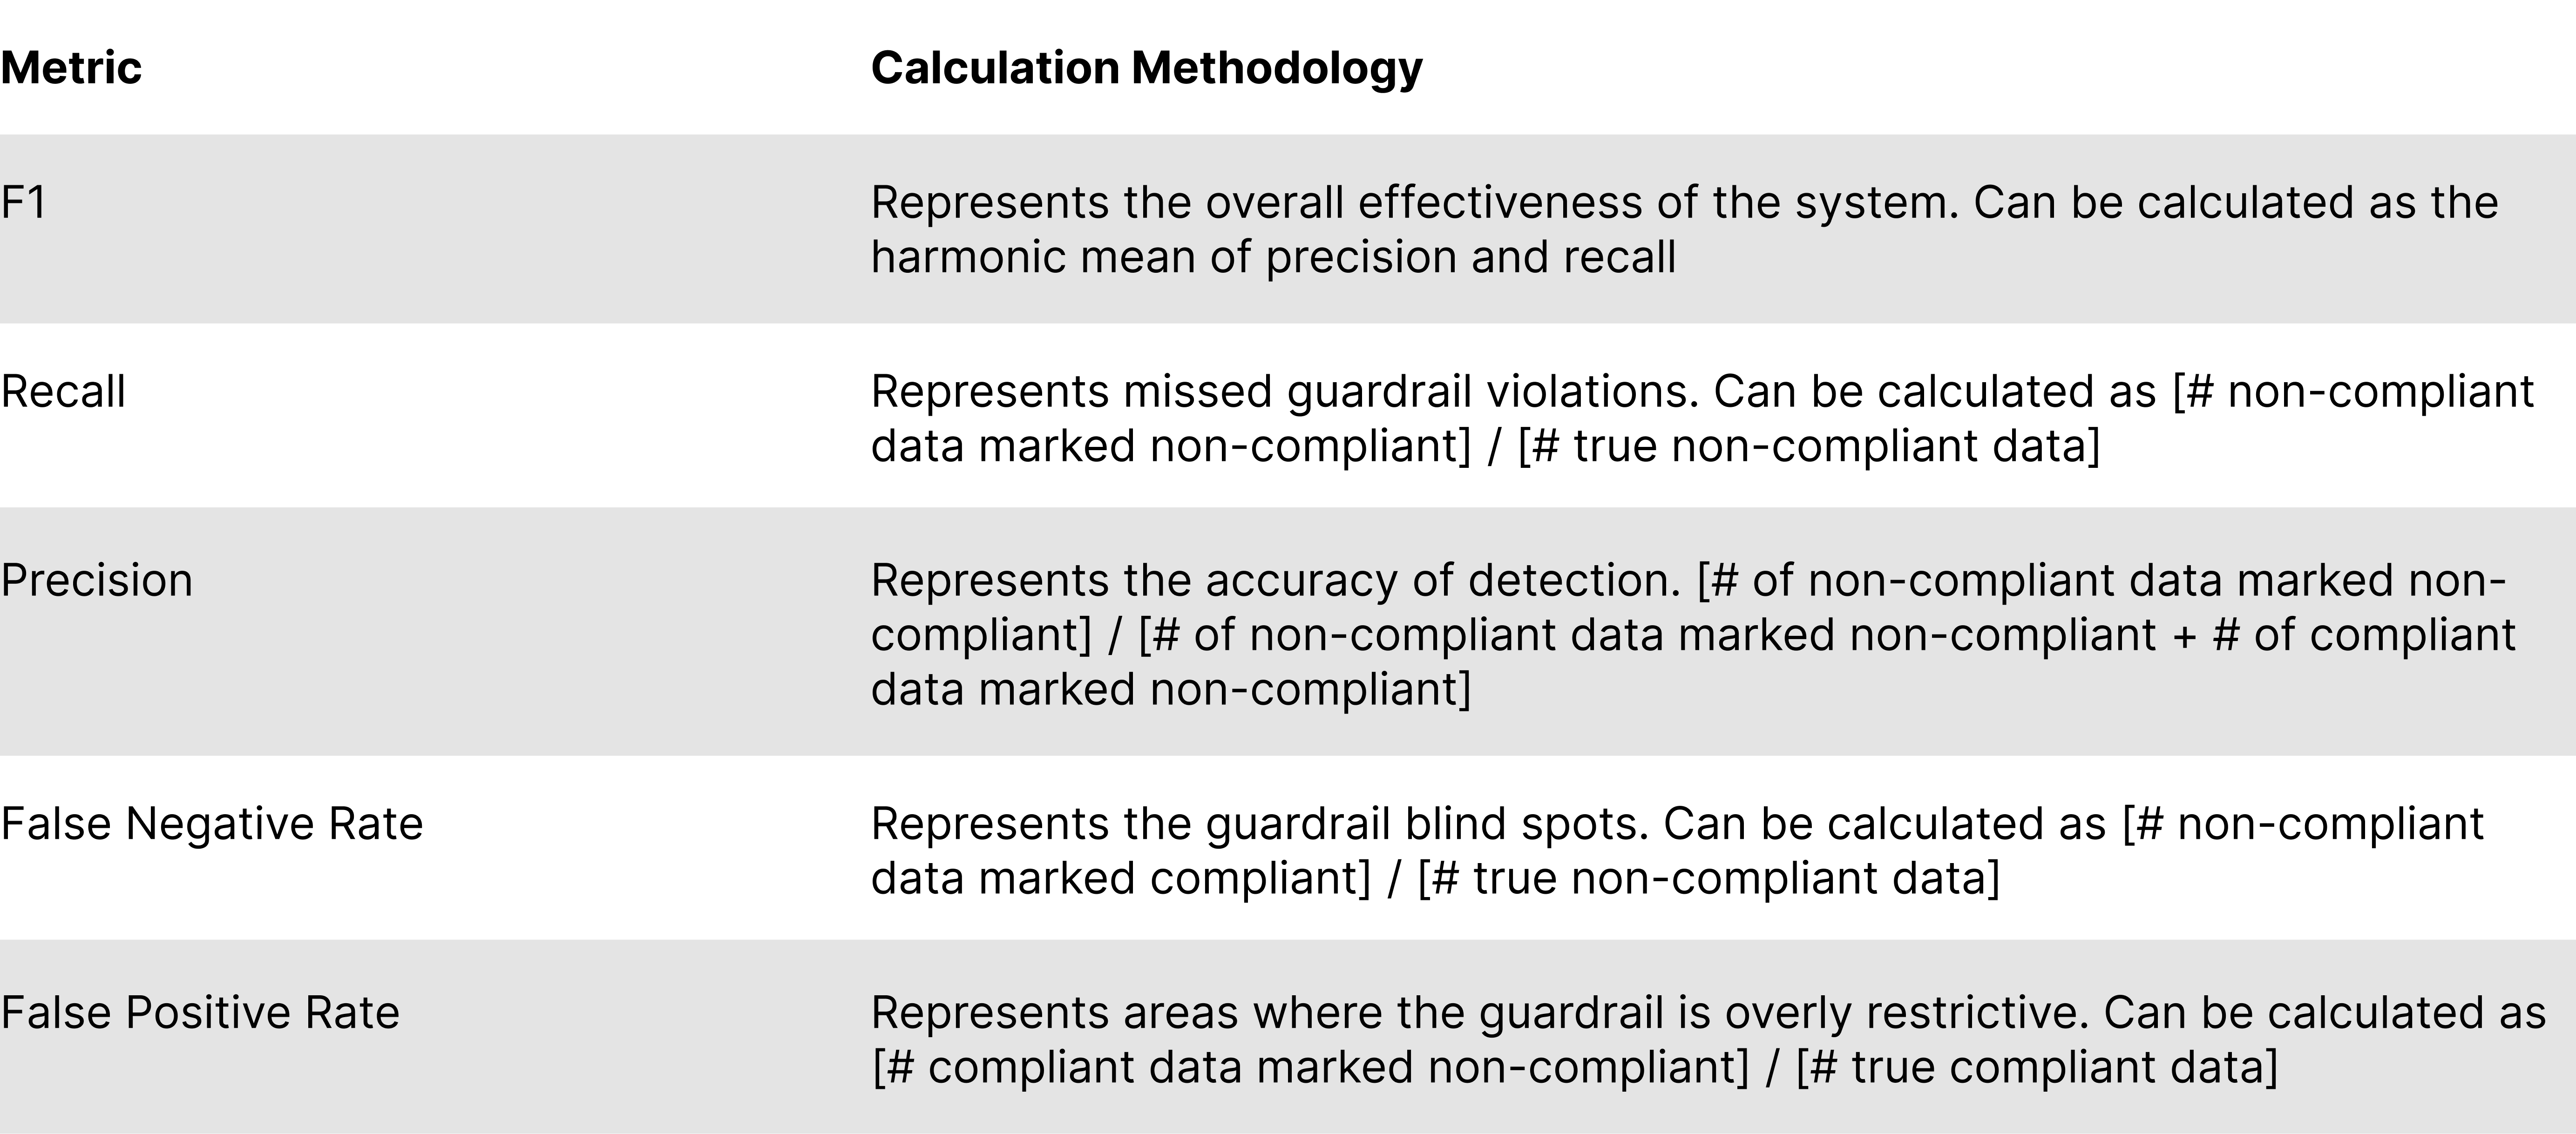
- Recall (or True Positive Rate): measures the % of non-compliant content correctly caught by the guardrail. High recall is essential for a high performing guardrail, however, it must be balanced with other metrics. For example, imagine a model that always flags everything - the model will have perfect recall, but a very high false positive rate.
Axis 2 - End-User Experience: Minimizing Frustration
Guardrails must also be evaluated for their impact on end users, as overly restrictive systems can degrade the user experience. Key considerations include:
- False Positive Rate (FPR): FPR measures the % of compliant content that is incorrectly marked as non-compliant. High FPR indicates overly restrictive guardrails, which can prevent legitimate usage and harm user trust. Balancing recall with FPR and precision is essential for achieving effective and user-friendly guardrails.
When applying multiple guardrails to a model, FPR can "stack" or accumulate across the entire guardrail system, increasing the overall rate of false positives. This is because as more guardrails are added, the likelihood of a false positive occurring in any one of them can compound, leading to a higher combined rate. Therefore, it’s important to outline both the specific tolerable FPR of a single guardrail, as well as the guardrail system as a whole.
- Latency: Guardrails often introduce additional processing time. Larger or more complex models may result in significant latency, which not only degrades the user experience but also increases operational costs. Enterprises need to consider whether the benefits of a guardrail justify any added delay.
Axis 3 - Scalability: Growing your Usage
Effective guardrails must be scalable to meet the demands of high-traffic applications. Scalability is evaluated based on:
- Throughput: Can the guardrail handle the volume of requests expected in real-world deployment without compromising performance? This can be measured by calculating the Requests Per Second (RPS), or how many predictions or inferences a model can generate per second.
- Costs:
- Server Costs: Implementing guardrails can be resource-intensive. For example, using large models may incur substantial costs due to the token-based processing required to add system instructions. Similarly, systems like Llamaguard may require a dedicated GPU for each guardrail, which becomes unsustainable at high queries per second. DynamoGuard bypasses both of those limitations by using small, lightweight models to support each different benchmark.
- Precision: Precision directly affects the cost of human oversight. If a guardrail’s precision is low (e.g., 20%), the number of cases requiring manual review increases fivefold compared to a system with 100% precision. This can drive up operational expenses and reduce the overall scalability of the solution, since every false positive creates more work for the human who has to review and discard it.
Balancing the Three Axes
Depending on the AI system, use case, and even the specific guardrail that is being evaluated, the balance between the three categories of metrics may be different. For example:
- When Risk might be of increased priority:
- Safety Guardrails: AI systems designed to moderate harmful or abusive content on social media platforms must prioritize recall to ensure harmful content is consistently flagged.
- Prompt Injection Guardrails: Guardrails that protect against malicious attacks, such as unauthorized data access or model manipulation, must reliably detect and block threats to maintain system integrity.
- Use Cases Involving Financial Data: AI systems that process sensitive financial information, such as robo-advisors or loan eligibility models, must enforce strict compliance with financial regulations and ensure the accuracy of their outputs to prevent legal or reputational risks.
- When User Experience might be of increased priority:
- AI Customer Service Chatbots: A chatbot designed to assist customers must balance guardrails to avoid false positives that prevent valid requests from being addressed. Excessive latency or overly restrictive filters can lead to poor customer satisfaction and reduced engagement.
- When Scalability might be of increased priority:
- Consumer-Facing AI systems: Virtual assistants or recommendation engines deployed to millions of users must ensure that guardrails do not introduce significant computational costs or bottlenecks. For instance, real-time response requirements make low-latency guardrails crucial.
7.4.3 ROC Curve Analysis
A threshold is a decision point that determines the cutoff for when content is classified as unsafe or safe. After benchmarking the guardrail model, the ROC (Receiver Operating Characteristic) curve and the AUC (Area Under the Curve) metrics can be used to find optimal threshold for your guardrail, depending on your intended use case. This is because the ROC curve sweeps across all possible thresholds, showing you the trade off between false positive rate and recall at each point. This enables a more nuanced evaluation than simply focusing on metrics like recall or false positive rate alone.
The ROC curve shows the relationship between the True Positive Rate (TPR, when the guardrail correctly flags content) and the False Positive Rate (FPR, when the guardrail incorrectly flags content) at different thresholds. By looking at the curve, you can decide if there are certain thresholds that are preferable for your guardrail because of the additional gain or loss in TPR or FPR.
For example, in a case where catching malicious content is extremely important, even at the expense of some false positive flags, you might choose a model threshold that maximizes the TPR, even if it slightly increases the FPR. Conversely, in cases where minimizing false alerts is essential - such as when false flags could interrupt valuable user interactions - you might select a threshold that reduces the FPR.
The AUC is a single scalar value that summarizes the performance of a guardrail across all possible thresholds. A higher AUC indicates that the guardrail consistently achieves a better balance between TPR and FPR, making it a useful metric for comparing different models against each other.
💡 ROC Curve Examples
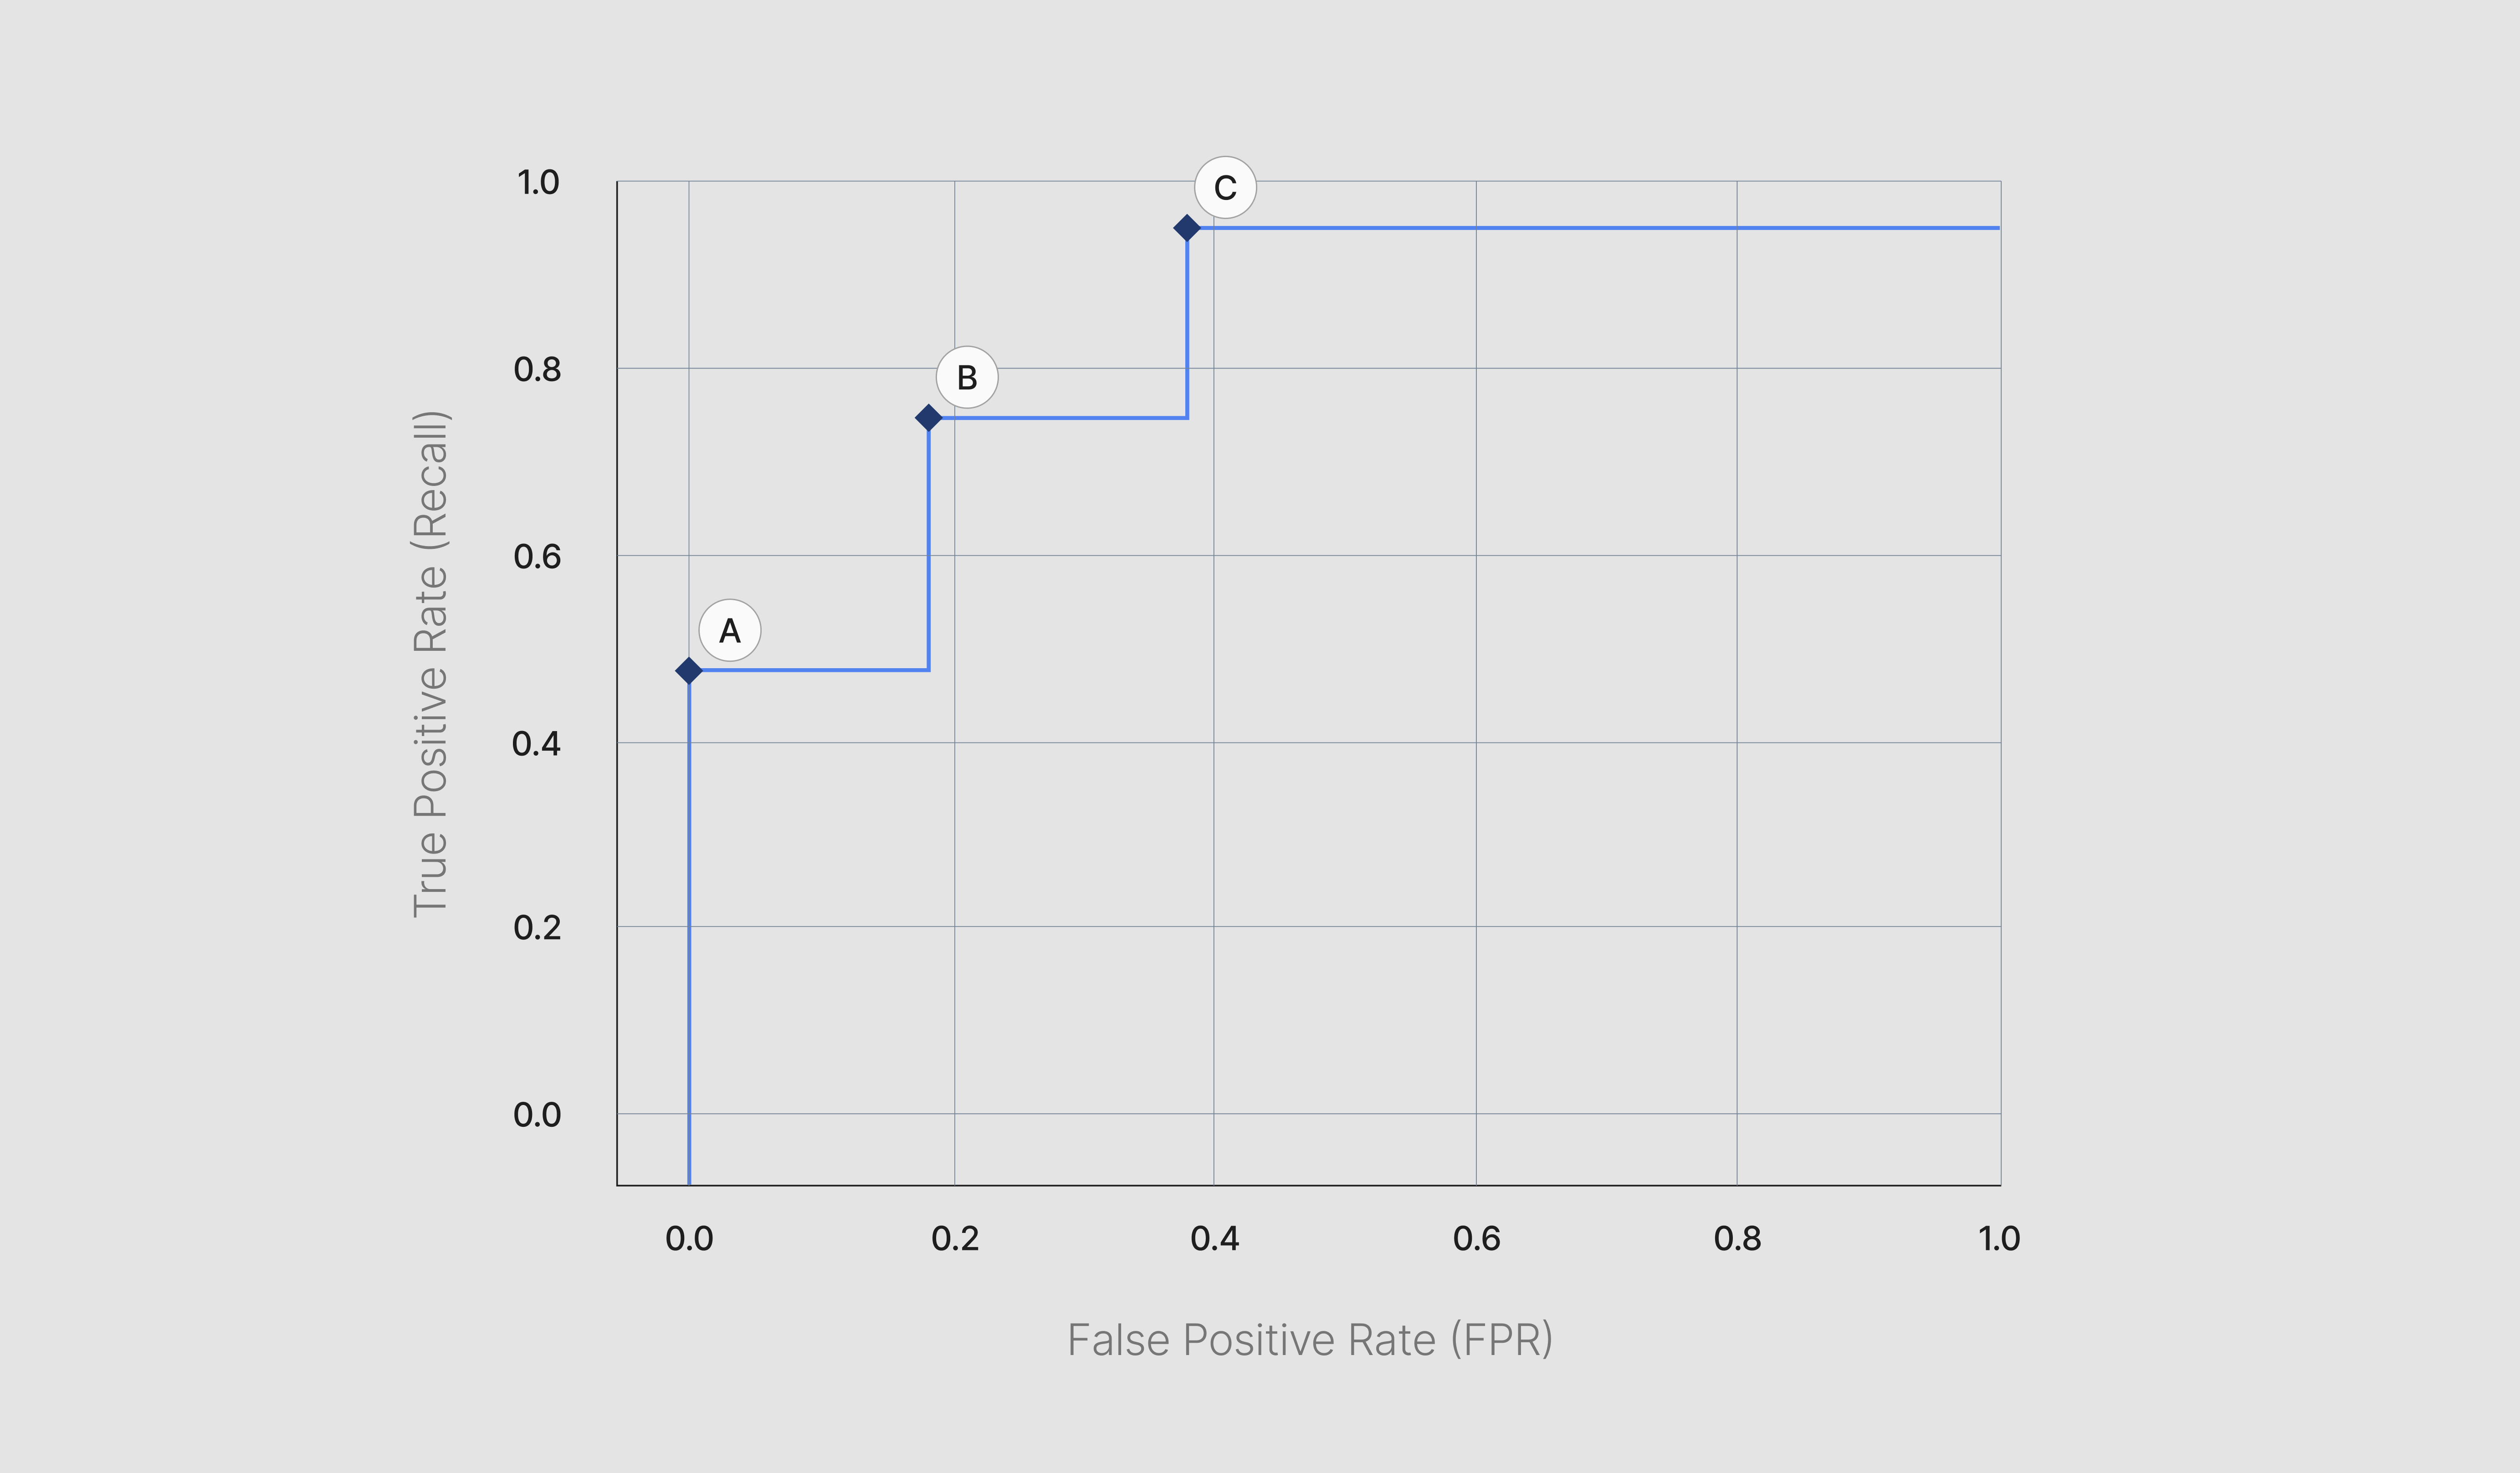
In this example below, you can see three threshold points - A, B, and C - for a dummy hallucination guardrail.
- When the threshold is set to A, the model does not accidentally mark any safe text as hallucinations, but also does not perform especially well at detecting actual hallucinations.
- In comparison, at threshold C, the model is very good at detecting hallucinations, but also incorrectly marks non-hallucinations as hallucinations at a high rate.
- In the middle, at point B, the model displays a balance between the two other points.</aside>
7.4.4 Failure Mode Analysis
Finally, to get a qualitative understanding of the guardrail’s weaknesses, enterprises should audit the benchmarking data and then manually verify these weaknesses by redteaming the model to discover common patterns of failure, known as failure modes. An example of a failure mode could be for example, “the guardrail performs poorly on data that is more casual in style”. Example prompts that demonstrate this failure mode would be “hey wazzup” vs. “Hello, how are you?”. Categorizing and examining these failure modes is necessary for product or risk teams to determine whether the guardrails can be released because it will outline the common errors a user might experience if the guardrail were to be put in place. In addition, these areas of model weakness can then be tracked over time so that ML teams understand where to try and improve the model.
It’s also important to understand that not all failure modes should be weighted the same. Accidental, non-intentional violations, where users accidentally bypass a guardrail and see content that should be restricted, can be especially harmful because they expose everyday users to unintended output, whereas malicious styles of errors that normal users would never run into are less common and therefore less harmful overall. Therefore, Dynamo AI recommends tagging failure modes by whether or not they are accidental or malicious in nature. This can help teams prioritize the severity and focus on which failure modes to address.
To find a single failure mode, start by auditing the benchmarking data to see if there are any common patterns. Next, see if this pattern can be qualitatively grouped together into a single type of error. Finally, verify and confirm that the guardrail does indeed fail when exposed to this type of situation. Manually redteaming the model by testing on additional data that is inside the failure mode but not exactly the same as the data from the benchmarking set.
7.5 Success Criteria
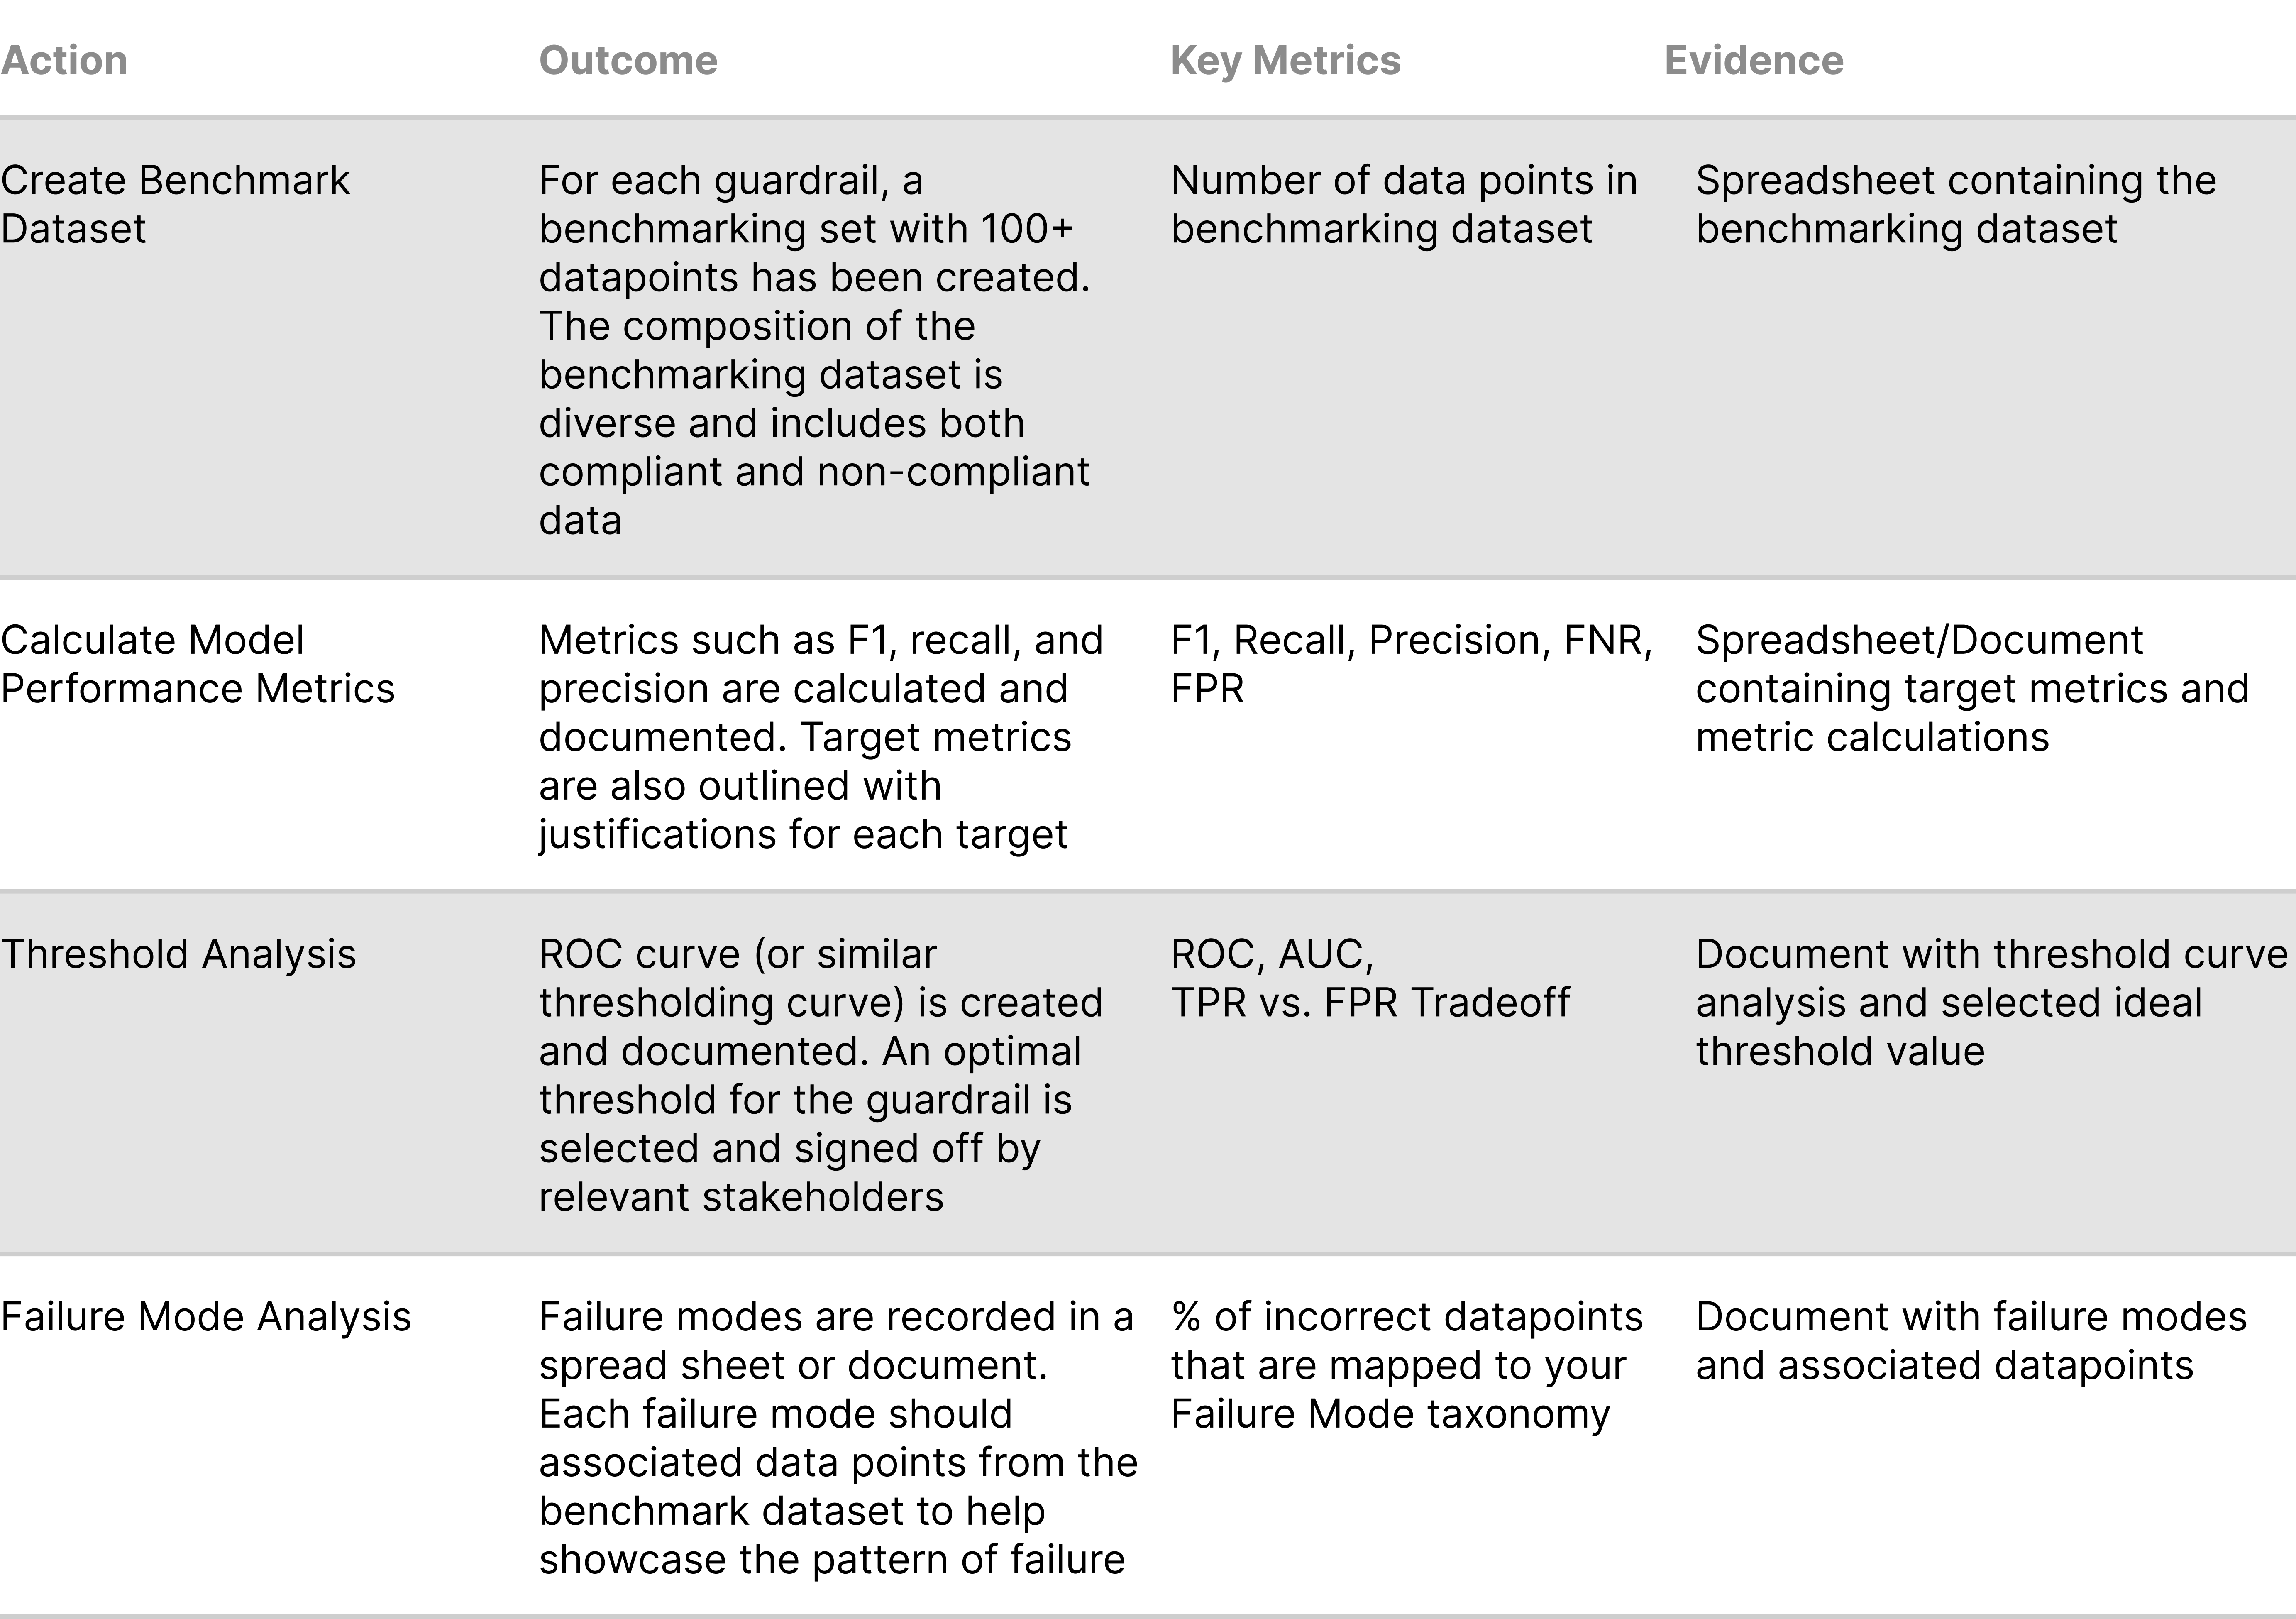
The following table provides success criteria for executing Guardrail evaluation:
1. https://arxiv.org/pdf/2310.10501


.webp)
